Human Managed app hm.works 1.7 released with dashboard on denial-of-service (DoS) detections
Since its first release on 13 March 2023, the Human Managed web app hm.works has been getting fresh updates every single week to report on intel generated from any data source from our customers.
This week, we are excited to announce the release of a dashboard that reports on the detections of possible denial of service (DoS) for our customer's public facing applications.
Introducing...
Denial of Service (DoS) Dashboard
Our DoS Dashboard reports on various detection use cases that hm.works runs on the data generated by your users, services, products, and resources.
The hm.works platform analyzes logs from multiple data sources such as CDN, WAF, and firewalls to:
- observe the volume of incoming traffic and requests to customer applications,
- dynamically calculate the baseline of expected volume of traffic and requests, and
- detect events of interest such as volume deviations and peaks from the baseline.
A single page answers the top 3 things you need to know about potential DoS attack so you can speed up response actions and take proactive measures:
- What volume of traffic or requests are directed at my assets?
- What is the traffic / request deviation from baseline over time?
- What are the DoS attack patterns observed?
What's DoS and why is it important?

Denial-of-Service (DoS) is an attack technique to disrupt a service, such as web services or applications, by overwhelming it with illegitimate or high volume of traffic.
A successful DoS attack can degrade your services quality by causing loss, delays or interruption -- resulting in financial and reputational damage and customer dissatisfaction.
In a world where customers and users' interactions with your business is increasingly digital, it's important to know what to observe in your data, what is 'normal' vs. 'abnormal' behavior, and when to take action.
* * *
Let's explore each segment of the DoS Dashboard.
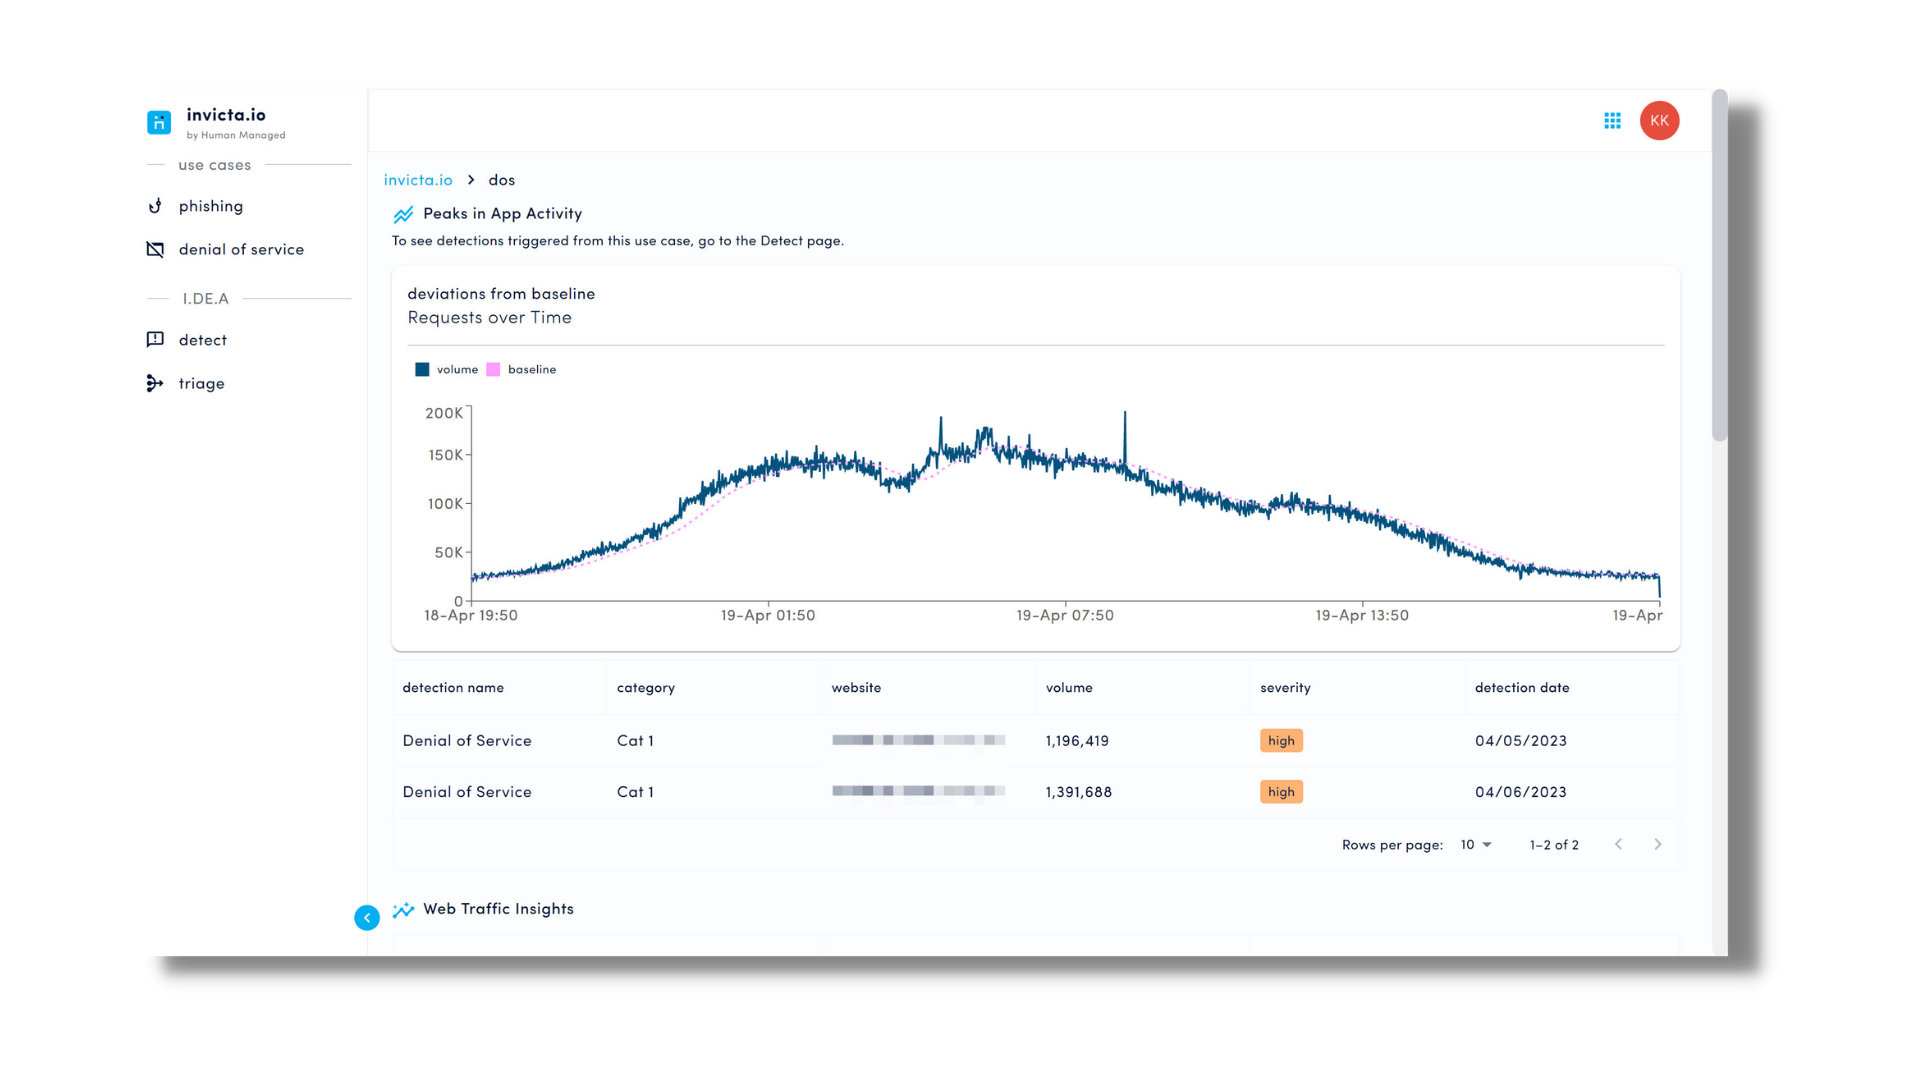
Requests Over Time
- What: This line chart reports the volume of incoming requests made to your public facing services and the standard deviation baseline volume of requests over time.
- Why: Helps you to understand the patterns and anomalies of your application environment from the traffic and request detections generated over time, which guides your next course of action.
- How: Forward data from web application firewalls, CDN, or edge networks. Customize legitimate URLs to monitor on the hm.works web app.
Denial of Service Detection Grid
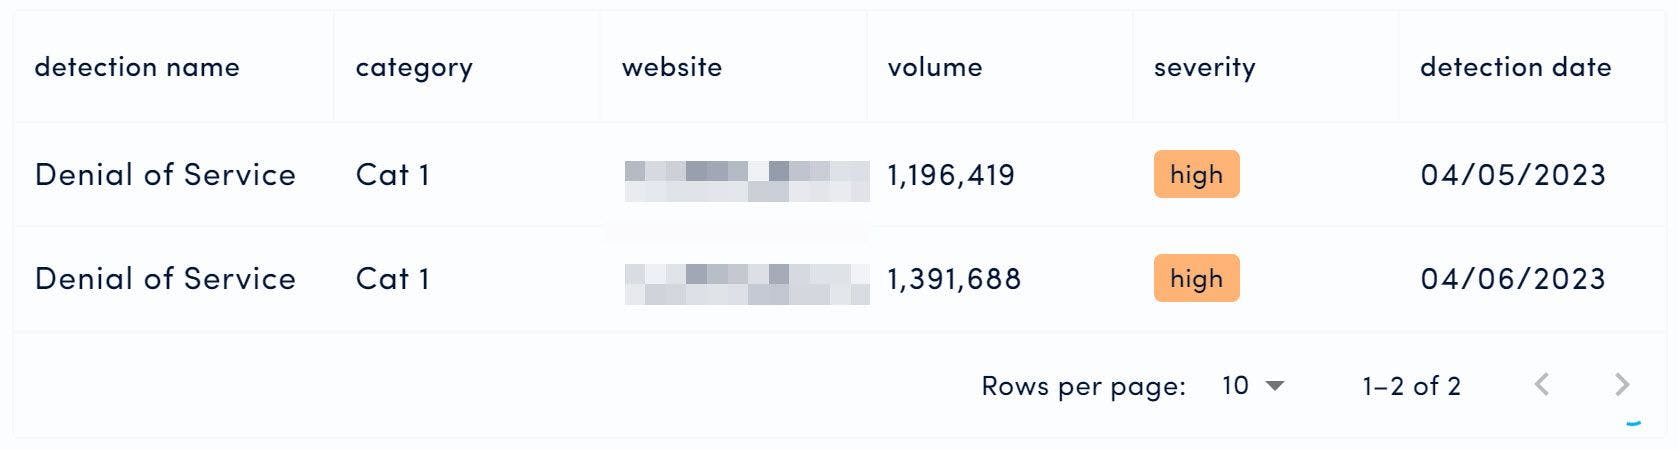
- What: This interactive grid lists suspected DoS detections generated by hm.works, the observed URL, volume of requests, and detection severity.
- Why: Having the details of suspected DoS detections allow you to investigate and take decisions on the next course of action (to react and/or resolve) in response to the threats.
- How: Forward data from web application firewalls, CDN, or edge networks.
Web Traffic Insights
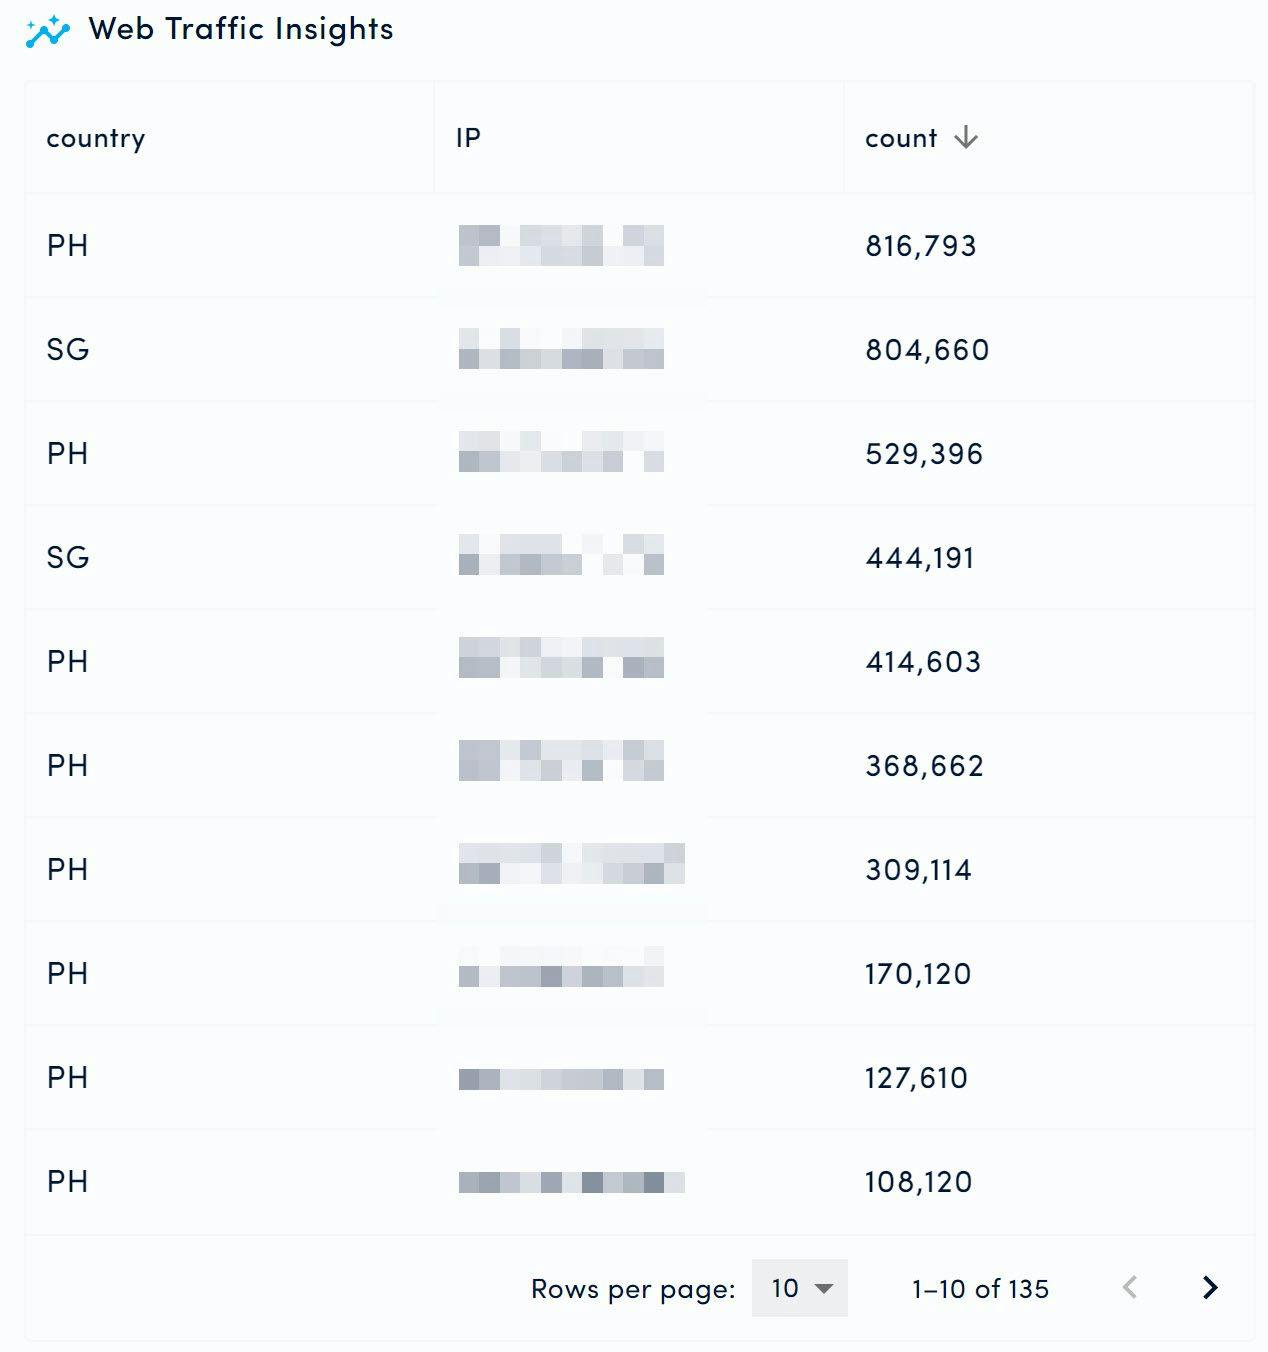
- What: This interactive grid breaks down other insights of interest from the web traffic data observed by hm.works, such as the incoming requests' originating country, IP addresses and counts of requests.
- Why: Helps you identify new traffic / request patterns or validate known patterns to inform response action
- How: Forward data from web application firewalls, CDN, or edge networks.
* * *
And that is hm.works 1.7! We will be releasing more features and updates regularly, so stay tuned.
To get the latest news from Human Managed, follow us on LinkedIn and check out our blog.
* * *
Want to discuss how we can help solve your cyber, digital, or risk operations through data?
Want a test run of the hm.works app?
Have any questions or feedback?
Please contact us at hello@humanmanaged.com.